I've got the Blender Add-on calibrated and motion capture working. But walking and jumping are not captured -- the avatar is kept in place by the base node/bone. How to unlock the base?
Blender Motion Capture - Walking, Jumping
- Edited
There's no way to activate it, this feature is currently not implemented.
As you know, the chordata system is still on prototype stage, and it was built by a small team with minimal resources.
We would love to add the "root bone translation" right away, but it requires implementing complicated algorithms which is something we cannot do with the resources we have available at the moment.
If you want to see this feature become real please help us spread the word about the upcoming kickstarter campaign. For example sharing videos of your working chordata suit would be great. I guess you are the first of this round to have it running!
Also take a look at this thread where we set up the basis for the implementation of a root bone translation algorithm. In the thread you will also find the link to the WIP code repository
hey AxonSpark!
The new addon will include the root bone height display option as you suggested, but no the translation
I've cloned the Blender Add-on repository. I'd be happy to work on the algorithms needed to lock the feet to the floor. If you could point me in the right direction, I could work on it. Cheers.
It's great you are willing to give it a try.
Have you seen the other thread I mentioned? everything is explained there. Note that the development of this algorithm is being carried out in a separate repo. Once we have the Matlab script translated to python we can port it to the addon
Thanks, I will check it out. Cheers!
daylanKifky Where might I find the matlab scripts to be translated into Python?
Everything is in the repo. I also started the process by making a jupyter notebook with comments. The idea is to use that notebook to translate the algo step by step
daylanKifky I've been updating the Jupyter file with the Python translation. I've ported some of the scripts from the italogsfernandes repo.
How would you like me to update the repo?
- Edited
Teleman
great!
do you have a gitlab user? I can include you as a collaborator
daylanKifky My Gitlab username is Telemanage
Done. You won't be able to push directly to master, please create a new branch
daylanKifky I've pushed my changes to the new branch DEV_teleman.
What next? ;-)
- Edited
Teleman
Great, thanks a lot for taking the time to go through this! It will be an outstanding contribution to the system!
but I'm afraid it is currently not giving correct results. These type of algorithms are really delicate, so when attempting a translation like this it is important to double check the results at every "checkpoint" (in this case we are using the intermediate plots as checkpoints).
The idea is to compare the output of the python script with the one from the matlab script at each one of the checkpoints.
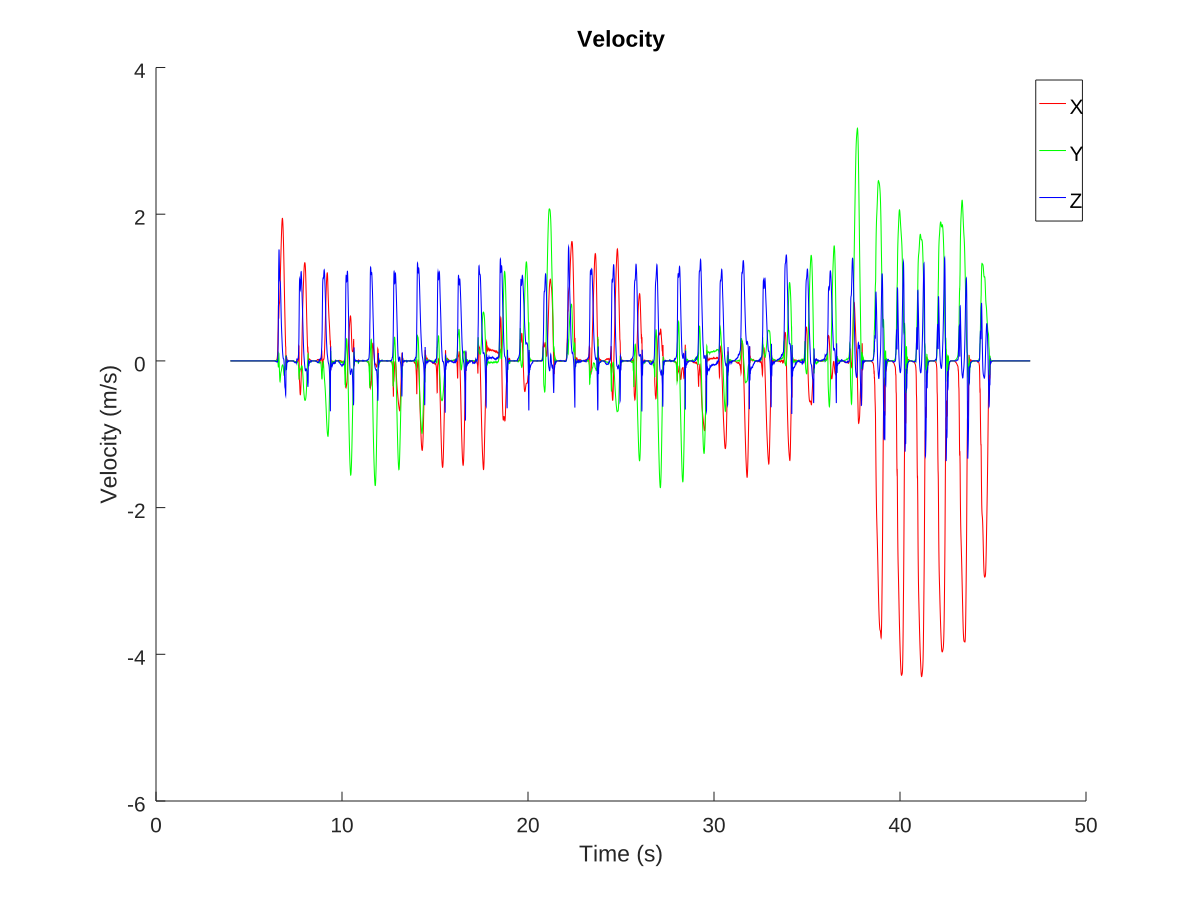
To take a significant one as example: comparing the translational velocities
plot give completely different results. Note how the resulting velocity on all three axis remains stable at zero on the matlab plot, while it drifts notoriously on the python one.
matlab translational velocities
python translational velocities
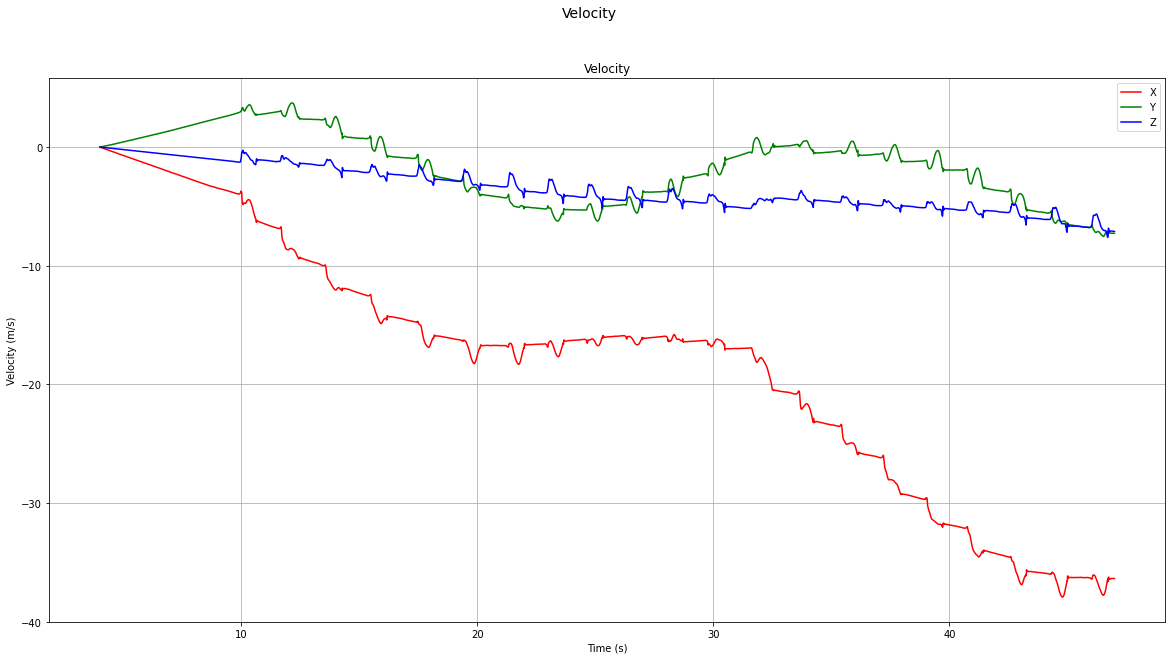
If you go further and compare the translational position
plot (not pasted here) you will see how the delta in position is no greater than 10mts, while in the python one there's a delta in position of about 500mts!
I would suggest to take a step backwards and translate it one step at the time, making sure the partial outputs match.
For example, in the first checkpoint Plot data raw sensor data and stationary periods
the important thing to get right are the stationary periods, which in the matlab script get plotted on the accelerometer figure. On the python script on this step there's only the gyroscope figure plotted, which doesn't give you much information.
Note: in order to control the size figures get plotted in the jupyter notebook, this line can be added before the first plot:
import matplotlib.pyplot as plt
plt.rcParams['figure.figsize'] = [17, 6]
How do I get the matlab plots? I'm not sure how to run matlab.
Matlab is a proprietary platform, I'm not sure they provide a way to access it for free. But there's Octave, an open source interpreter developed by GNU which is almost completely compatible with the matlab script.
After installing it you should navigate to the Gait Tracking With x-IMU
directory and execute the Script.m
.
The navigation inside Octave is equal to the one in bash
, so cd
to change directory, etc.
In order to execute the contents of a file you just have to call it without the .m
extension. So in this case you will have to call
Script
It will take a while, and it will open one new window for each plot. You can navigate and export the plots from these windows.
If you want to execute the script partially (for example to get just the first plot), just add a return
statement where you want it to stop.
You might find a couple of issues when running this particular script with Octave
. The workarounds are described in the README of the repository
daylanKifky Thank you. Perhaps in the mean time, would you please post the matlab plots for the 3 datasets - straightLine, stairsAndCorridor, & spiralStairs? I can then use them for comparison to the plots from Jupyter.
- Edited
I strongly recommend you having your instance of Octave running to do this. Here's the first accelerometer plot of the spiralStairs
dataset as an example (with the stationary periods in black). But having them as fixed images won't serve you much. Instead being able to zoom and inspect the plots will be the only way to ensure you are getting correct results.
By the way, the plots give you a good idea of the overall partial result, but sometimes comparing the results numerically will help you confirm they are correct, and make your life much easier. That's another reason for having the Octave interpreter running